I. Introduction
There is an oft-cited hierarchy for data, wherein ideally it should flow:
Data –>Information –>Knowledge –>Wisdom (DIKW). Just because you have data, it takes some processing to get quality information, and even good information is not necessarily knowledge, and knowledge often requires context or application to become wisdom.
For example, you could have raw, infrared thermographic images (data), which lead you to think you have a heat source inside of a house (information), and then allegations of marijuana being sold from the house suggest that the house is a drug dispensary. This might enable police to think that they enough knowledge to arrest the occupant (although not in all U.S. states).
But, the police would be lacking the wisdom that needs to supersede all of this data, information, and knowledge. Specifically, they would have not had the wisdom in 2001 to foresee that thermal imaging of a home, like Danny Kyllo’s home, constituted a “search,” and thus violates the Constitution’s 4th amendment since the police did not have a warrant. In this case, Kyllo had a reasonable expectation of privacy since most people do not have thermographic vision or methods to see in thermographic vision (the Predator notwithstanding). So, even when you have data, information, and knowledge, a broader context is needed to have wisdom. While this may seem like an odd legal introduction for a metagenomics post – stay with me… privacy, wisdom, and genomics will all come together in the end.
II. Metagenomics of Cities
Recently, our paper published in Cell Systems surveyed DNA of the entire NYC subway system, and it has served as a good analogy of this hierarchical nesting. Specifically, we had fragments of DNA (data) that matched a myriad of species (information), and some of these species were alive through functional data in cultures (knowledge).
These data led us to five exciting metagenomic conclusions:
1) Interestingly, 48% of the DNA did not match any known species, indicating a wealth of discovery left in metagenomics and genome assembly projects. This was in range with another recent study from urban air metagenomics.
2) A “molecular echo” could be seen from marine-related bacteria in a subway station flooded by Hurricane Sandy, distinct from the Gowanus Canal in Brooklyn, which created a subway version of the “microbiome aura” posited by Jack Gilbert and Ed Yong.
3) As far as we know, this was the first demonstration that human alleles and their predicted ancestry left on surfaces can match the U.S. Census data demographics in a city, which was previously shown across Europe.
4) We measured the rapid pace of metagenomic dynamics over the course of a day on a public surface.
5) We showed that metagenomics profiling can reveal the likely source of antibiotic (tetracycline) resistance.
We were excited about all of these data and their release, and even made a map so you could look up any organism from any kingdom and play with the data, and the Wall Street Journal made a cool map too. But, what we did not appreciate was the avalanche of fear-based responses that came from the press after reporting that a handful of samples (out of almost 1,500) matched fragments of Yersinia pestis (Yp) and Bacallis anthracis (Ba). We only claimed evidence in our paper for the DNA of these species, we specifically noted there was no evidence that they were alive, and even hedged our discussion on Yp and Ba with statements such as “if truly present.” Yet, the casual mention of pathogens in our paper created a public impression that pathogens were present and pervasive in the subway.
The subsequent discussion of the data has made me appreciate a new, DIKW-like hierarchy, which could be called “DSOP:”
III. DSOP: DNA – Species – Organism — Pathogen
Even if you have DNA fragments, and you correctly match it to the right species, and you have evidence that it is coming from a living organism, this still does not mean you have a pathogen. Pathogenicity, as we state in the paper, “depends on many factors: infective dosage, immune state of the hosts, route of transmission, other competitive species, informatics approaches to species identification, horizontal transfer, bacterial methylome state and unique base modifications, and many others.” Most importantly, to be a pathogen it has to be shown to be infectious, usually along the lines of Koch’s postulates.
In the case of our paper, we had Data that indicated some Species, which we claim in the paper. But to say we have knowledge about their source, or whether they are living Organisms, would take more work. Most importantly, to claim wisdom that we know the best practice for large-scale city management is also beyond the scope of our paper — it was the first survey of a city’s transit system and serves as a snapshot. The really interesting data will come when we examine it over time, and compare it to other cities.
This large interest/excitement/fear/curiosity in our study on city-scale metagenomics and species identification has led to some questions about the data, which I post some clarification below, specifically on how we went from DNA (data) to species (information). But, it is good to say again, we do not claim that any of these organisms are alive, and most especially we have no evidence they are pathogenic. Also, even though bacteria on the subway show antibiotic resistance, this is also not cause for concern, since many bacteria are intrinsically resistant to antibiotics. I have looked at these issues from the two areas of the DSOP hierarchy that we know, DNA–>Species.
- Data (DNA):
Details on the study are published; but briefly, the data used in the study were billions of fragments of DNA that were sequenced as paired-end (PE) reads (125×125 nucleotides, or nt, and some 100x100nt) from an Illumina HiSeq2500 sequencer, which is currently the next-generation sequencer (NGS) with the lowest first-pass error rate. Samples’ DNA were collected across New York City (NYC) using a mobile app (freely available) that recorded the GPS coordinates for the samples, as well as photo documentation, for the Copan nylon swabs, and DNA was extracted with MoBio PowerSoil kits. Since NGS instruments have been established for almost a decade, the accuracy of DNA sequenced from the Illumina instruments is now at 99.9%. As such, we have high confidence in the quality of the DNA sequence data from the study. But, how do we turn that data into information? Let the sequence alignments begin!
- Information (Species):
In an ideal world (and one that is getting closer with Moleculo, PacBio, 10X, and Oxford Nanopores), we would sequence entire plasmids and chromosomes and get megabases (Mb) of contiguous DNA in one first pass, and we could unambiguously know which species is present. But, today, we usually get short fragments (100-125nt) and we have to try and find the best match. There are many tools for the identification of short DNA reads against all known genomes, and we chose four: (1) MetaPhlAn, which uses unique genetic markers to find species-specific fragments of DNA, (2) BLAST, which uses a Smith-Waterman algorithm and other heuristics to compare one sequence against all known genomes, (3) SURPI, which uses two aligners (SNAP and RAPSearch) to compare sequences to known pathogens, and the (4) Burrows-Wheeler Aligner (BWA), which used a compressed reference genome to rapidly search for matches. We found hundreds of potential bacterial species by these tools, and it is worth repeating here that most of them were perfectly benign or inert towards human health. But, interestingly, in our data set, we found rare cases where all four methods seem to indicate that Yp or Ba was present. But how do we know this information is correct? How can this data become information? Is it real?
IV. The Yp genome
The simplest (and often the best) way is to look at the presence of DNA from an organism is to look at where, and how, the short fragments of DNA map to the genome.
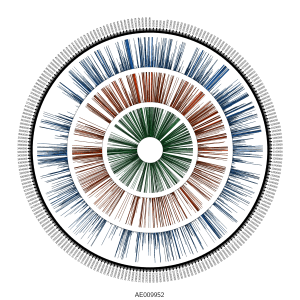
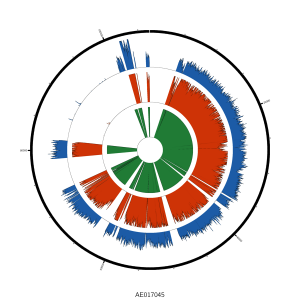
Globally, we saw reads mapping across the genome:
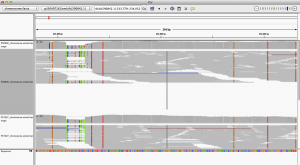
When we look closer at the coverage across the reference genome of Yp, using the free integrated genome viewer, we see some areas of high coverage (gi|30407161|emb|AL590842.1|:233,779-234,032), but we also see many single-nucleotide polymorphisms (SNPs, vertical lines), which means there has been a mutation or a mis-match of the DNA from our sample versus the reference genome:
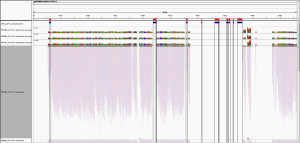
But, as pointed out on Twitter (great analysis by @WvSchaik and @pathogenomenick) and in blogs (Ed Yong’s post at National Geographic, and also in our manuscript, just because you map to a region of a genome, it could be the same as another part of a similar, related bacterial genome. Thus, certain tools like MetaPhlAn have worked around this problem by searching for unique areas of the genome for each species. When we look at the Yp genome and map the unique areas from the MetaPhlAn database, we can see that almost none of the areas of the Yp genome that are unique to Yp (red/blue bars, on top) show reads that map.
This figure is notable for two reasons. First, most of the genome of Yp is too similar to other species to uniquely identify it, and thus even deeply re-sequenced areas and mapped reads do not necessarily represent Yp. This is a general challenge for metagenomics, wherein reads that look to be mapping to one species can be only 1-2nt away from a perfect match to another bacterial species. This is especially complicated in bacteria because they can readily share DNA by horizontal transfer.
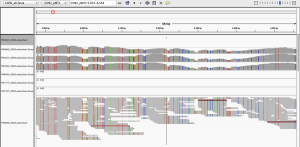
Second, only one of these Yp-unique areas shows coverage (left most region), meaning that there is only one covered area of Yp that could uniquely represent Yp. When we examined this coverage in more detail, it appeared in a differentially covered between samples. Some samples showed high levels of local coverage (e.g. P00606, P01027, P01090), whereas other samples where no algorithm predicted Yp (P00400, P01177, P01167) showed no mapped reads to this area.
So, does that mean that it is real? Even then, not necessarily. The big issue here is that there are still a fair number of SNPs (vertical lines) across this region, and when you see too many SNPs, it either means that this strain is very mutated and diverged, or that this is the wrong species. There is strong convergence and shared sequences within Yp and across the Enterobacteriaceae family (including organisms like Salmonella, Klebsiella, Shigella, and E. coli), and the same issue can occur within the Bacillus family, between Bacillus anthracis, Bacillus cereus and Bacillus thuringiensis.
We discuss this in the paper, noting that while there is some evidence of Yp-related sequences, it is at the cutoffs we considered as the limit of detection for BLAST and MetaPhlAn. We kept it in the paper since were also saw distinct predictions, from the same samples, for related species (cereus, thuringiensis, etc.). BUT! Given the rarity of Yp in the East Coast, any good Bayesian would take the prior probability of this being Yp as so low and assume that it cannot be there. By these very reasonable assumptions, we could have just not reported it in our dataset and assumed it was a false positive. So, why did we keep it in?
V. Reporting Yp; change the database, change the answer
We reported all of these results for two reasons.
First, once the data were published, anyone could download these data and see the same algorithms predicting Yp or Ba. Indeed, in about five quick steps, you can do it with online tools like Galaxy and MetaPhlAn.
1) Download the raw, publicly available data: ftp://ftp-trace.ncbi.nlm.nih.gov/sra/sra-instant/reads//BySample/sra/SRS/SRS802/SRS802263/SRR1749190/
2) Download the SRA toolkit: http://www.ncbi.nlm.nih.gov/Traces/sra/sra.cgi?view=software
3) Use sratoolkit2.4.4 to convert SRA to Fastq, then Fastq to Fasta, like this:
>./fastq-dump.2.4.4 ~/Desktop/SRR1749190.sra
4) Upload data to the free Galaxy instance of MetaPhlAn 1.7 and run on default parameters: http://huttenhower.sph.harvard.edu/galaxy/ (props to the Huttenhower lab for setting this up for all to use).
5) Examine the output. Once done, you will see Yersinia pestis (highlighted in blue):
Secondly, we reported it was because all of the computational tools seemed to indicate some evidence of low-level Yp or Ba. But again, how can we know it is real? This was borne out by many late nights staring at IGV plots, with reads like these (below). For some of these fragments of DNA, according to BLAST’s knowledge of all genomes, they are best explained as coming from Yp. Specifically, from the .bam files, we can pull reads like this:
>PC140529:373:C36UKACXX:3:2111:20835:13378
AAGACCGCCTGCCGCAGCTTTTAGCGAGATATCCAGCCGCTCTTTGGAAATGTCATTCGCGTCCCAGCGGTGGCCGTTCCATTCGAAATAGACGGTGAAAC
>PC140529:373:C36UKACXX:2:2207:6712:90748
GCATCTGTCCAGAAGAAATTGTCCGGAAGACCGCCTGCCGCAGCTTTTAGCGAGATATCCAGCCGCTCTTTGGAAATGTCATTCGCGTCCCAGCGGTGGCC
>PC140529:373:C36UKACXX:2:2216:3349:23864
ATTGTCCGCATCTGTCCAGAAGAAATTGTCCGGAAGACCGCCTGCCGCAGCTTTTAGCGAGATATCCAGCCGCTCTTTGGAAATGTCATTCGCGTCCCAGC
>PC140529:373:C36UKACXX:2:2214:4391:51898
ATTGTCCGGAAGACCGCCTGCCGCAGCTTTTAGCGAGATATCCAGCCGCACTTTGGAAATGTCATTCGCGTCCCAGCGGTGGCCGTTCCATTCGAAATAGA
Also, most of these reads’ pairs also mapped best to this part of the genome, like these:
>PC140529:373:C36UKACXX:4:2312:9640:70842/1
TAAATGTGATAGTACCTTCCCTGTACCACATATTCTCTCCTTGAAAAGACGGGCATCCATGCCCGCCATAAGTAAGTACATACTTATTTTTACCGATGTAAAGATGGATGTCTACCGTCGAGCAG
>PC140529:373:C36UKACXX:4:2312:9640:70842/2
GGTTTCTTCCATAATATCCTTCTCCATTTTTAAGCCTTAAACACCAGAACGAGATAAGGCTCGTTAACACGGTGATTGTATTTACGCTGCTCGTGCCAGGTATAAACATCGACAGTTGCAGACTG
> PC140529:373:C36UKACXX:2:2208:15618:68333/1
TAAATGTGATAGTACCTTCCCTGTACCACATATTCTCTCCTTGAAAAGACGGGCATCCATGCCCGCCATAAGTAAGTACATACTTATTTTTACCGATGTAAAGATGGATGTCTACCGTCGAGCAG
> PC140529:373:C36UKACXX:2:2208:15618:68333/2
GGTTTCTTCCATAATATCCTTCTCCATTTTTAAGCCTTAAACACCAGAACGAGATAAGGCTCGTTAACACGGTGATTGTATTTACGCTGCTCGTGCCAGGTATAAACATCGACAGTTGCAGACTG
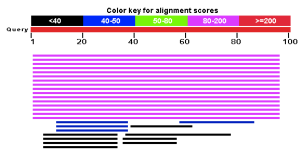
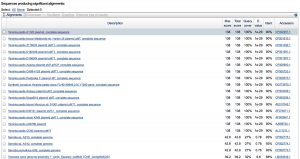
For reads like these, the current best match according to BLAST is to Yp. You can put these reads into the public BLAST database and see the same thing here:
http://blast.ncbi.nlm.nih.gov/Blast.cgi
We mentioned in the discussion that “it is always possible that improved bacterial annotations and newly completed genomes can move the ‘best-hit’ evidence to a different species in the Yersinia or Bacillus genera, or a different genus altogether.” Or, bacteria can pick up fragments of DNA from each other and appear as one, even though they are different. These are all possibilities, but the challenge is that we are only as good as our references.
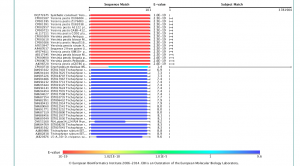
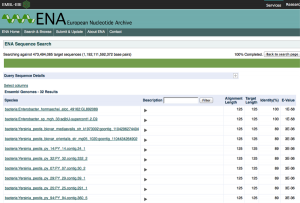
To highlight this point, we’ve looked further at our data relative to the European Nucleotide Archive (ENA) Sequence Search, which hosts a slightly different set of sequences than NCBI’s BLAST, and also the DNA Data Bank of Japan (DDBJ). Strikingly, when we use the DDBJ, we still get Yp as the top hit,
but when you use the ENA search system you do indeed get a better match, and to a different genus altogether (Enterobacter hormaechei), but still a potentially pathogenic organism the same family.
So which one is right? Given the match statistics, it is probably the ENA. But why are they different? This could be due to different rates of update between the databases, different data sets, or different organization of the data, but seeing this difference is likely just the tip of the iceberg. If we see 2/3 sequence databases reporting the less-perfect match, clearly this is an issue. In our paper, we only used the BLAST database at NCBI, which is clearly a limitation.
VI. The fragmented plasmid
We also looked at a plasmid that is associated with Yp (pMT1), where we found that most areas of this plasmid had higher coverage than the Yp genome itself. In the paper, we only showed a small area of the plasmid, but when we examine the entire plasmid, we see a mix of areas of very high coverage and some of absent coverage:
Interestingly, there are hundreds of Yp plasmids can range anywhere from 60-280kb, and so the fact that we see these areas of deletion could mean that this plasmid was mutated, or (again) it could be that the reads belong to another plasmid or genome for another organism. Among the variations of the pMT1 plasmid for Yp according to NCBI, some are annotated and some have only predicted genes, and we do note an error in our Figure 3 (well-pointed out by @WvSchaik); yMT is not covered when using the annotated plasmids that we have subsequently tested, and this is an erratum. Also, we found that Yp was found with MetaPhlAn 1.7, but not v2.0, yet still found with SURPI, BLAST, and BWA. Clearly, these alignment and annotation details are not trivial, since they can change a result from the presence of a putative pathogen to its complete absence, and this represents an ongoing challenge in genomics for all disciplines: human, bacterial, and meta. Thus, the penultimate and final parts of the DSOP hierarchy, that of the Organism and potential for a Pathogen, cannot be addressed, since even our species match is ambiguous is some cases. We can only say that we saw no evidence of these pathogens during our culturing experiments, and we certainly have no evidence of any pathogenicity.
The two most important aspects relevant to public health are that these DNA fragments, “if truly present,” are present at extremely low levels, and that there are no reported cases of either of these pathogens. That either means they are not there, or not there enough to be relevant, or not infectious, or in a modified state (as with modified nucleic acids), or not living, or some combination of the above. In any of these cases, no one should be concerned or worried about riding the subway, which we stated in the paper, and as often as we could in the press.
VII. Conclusions: the need for standards, “the 4th reviewer,” and metagenome privacy
The importance of computational analysis in metagenomics cannot be overstated, and Nick Loman and others have pointed out quite clearly. It is a clear problem that one can use different methods and to get dramatically different, unique answers from the same data, or complete data non-reproducibility. But, this is a recurrent issue for science in many fields. This includes microarray analysis (MAQC), clinical grade sequencing (SEQC), cross-platform discrepancies (ABRF), synthetic RNAs (ERCC), and even k-mer analysis of gene patents. Ongoing work to make metagenomic standards (MBQC) are pivotal, just as they have been for DNA-seq and RNA-seq, and our positive control with eleven titrated species in our paper is simply not enough. Ideally, titrated positive controls and cross-kingdom controls should be placed into each experiment, along with negative controls, even if there is no detectible DNA in the tube. Like all experiments, the data are only as interpretable as your controls frame it.
Yet, in spite of these challenges, improvements are coming. Nicola Segata’s beautiful species-specific markers in MetaPhlAn are great, but such maps have not yet been created for all fragments of DNA in NCBI, which would help us contextualize if this is really the best match for any set of reads across all references (genome, plasmid, and assembly). Such a measure of “mappability” helped regions of the human genome avoid mis-mapping of short reads, and you can see them here. Ideally, a “cross-kingdom mappability” index for every read, of any size, should be created, but unfortunately it does not yet exist. Also, as reads get longer, these problems will be solved. But, this will take some time, amid the many groups working on these fronts.
But, perhaps the bigger issue is social. I confess I grossly underestimated how the press would sensationalize these results, and even the Department of Health (DOH) did not believe it, claiming it simply could not be true. We sent the MTA and the DOH our first draft upon submission in October 2014, the raw and processed data, as well as both of our revised drafts in December 2014 and January 2015, and we did get some feedback, but they also had other concerns at the time (Ebola guy in the subway). This is also different from what they normally do (PCR for specific targets), so we both learned from each other. Yet, upon publication, it was clear that Twitter and blogs provided some of the same scrutiny as the three reviewers during the two rounds of peer review. But, they went even deeper and dug into the raw data, within hours of the paper coming online, and I would argue that online reviewers have become an invaluable part of scientific publishing. Thus, published work is effectively a living entity before (bioRxiv), during (online), and after publication (WSJ, Twitter, and others), and online voices constitute an critical, ensemble 4th reviewer.
Going forward, the transparency of the methods, annotations, algorithms, and techniques has never been more essential. To this end, we have detailed our work in the supplemental methods, but we have also posted complete pipelines in this blog post on how to go from raw data to annotated species on Galaxy. Even better, the precise virtual machines and instantiation of what was run on a server needs to be tracked and guaranteed to be 100% reproducible. For example, for our .vcf characterizations of the human alleles, we have set up our entire pipeline on Arvados/Curoverse, free to use, so that anyone can take a .vcf file and run the exact same ancestry analyses and get the exact same results. Eventually, tools like this can automate and normalize computational aspects of metagenomics work, which is an ever-increasingly important component of genomics.
Lastly, back to privacy, which has only recently developed as a large ELSI question in metagenomics. It is possible that a forensic metagenome signature may exist which could reveal one’s history of transit through a city, since allele frequencies across all kingdoms of life can be enriched or depleted across different boroughs or areas of a metropolitan area. Thus, one’s expectation of privacy is potentially lost as soon as you slough off cells from your skin, which include the genetic/epigenetic/metagenomic history of where you have been recently. The implications of this geospatial, genome history can even impact you in the home, just like the thermographic vision used by the police in 2001 in the Supreme Court case for Danny Kyllo’s home. But, here, if cells are sloughed from your body, and then escape through the vents of your house, into the outdoors, they are no longer considered private, and could reveal where you have been in the past day or week.
Can the methods really be that accurate? Could this really come to pass? It is not yet known how long, and across how many kingdoms, such a forensic signature might last. As long as we can accurately detect it, we will eventually know.


For the record, I personally think that ALL match / identity / similarity based methods for identification of taxonomic origins of reads are not ideal. I prefer phylogenetic analysis as it allows one to place a read in a full context relative to other reads. If a read is clearly most closely related to a region of a genome from a specific organism, it will show up in a phylogenetic tree close to that organism’s genes. Ideally, one would do this with genes known to be good indicators of phylogeny and taxonomy.
This is why we developed AMPHORA in my lab
https://phylogenomics.wordpress.com/software/amphora/
And then developed more recently Phylosift
https://peerj.com/articles/243/
And alos tested a suite of genes for how good a marker they are:
http://journals.plos.org/plosone/article?id=10.1371/journal.pone.0077033
Phylogenetic trees of such genes are useful because they allow one to distinguish spurious hits from non spurious ones … and still usually have enough resolution to identify taxa.
I would recommend carrying out such an analysis of this data … (or perhaps you already have and I missed it)
We haven’t done the assembly yet (ongoing now), but these are great other tools as well.
I would be particularly interested to see this phylogenetic analysis applied to the reads that were identified as “unknown species”. Seeing where these reads fit into the phylogenetic trees and evolutionary distances would be instructive for this analysis and help us better understand the evolutionary ecology of microbes in built environments.
Well, I will contact Chris and try to do this …
This illustrates very well that DNA sequences that are detected on building surfaces are not always equal to living organisms. Since the microbiome is defined as the group of microorganisms living and interacting within a defined ecosystem, I ask DNA scientists to be more rigurous when they characterize indoor microbiomes based only on either 16S sequencing or metagenomics.
Just a quick note as I am still reading the article on my super small screen. Why didn’t you perform a denovo assembly and then a phylogenetic analysis? This could give a more realistic image.
I was not involved in the analysis but if you want to get a picture of the relative abundance of different taxonomic groups it is better to analyze the raw read data since that can give you counts. So we do not use assembled data for such purposes.
Chris, thanks for putting your re-analysis online. I think your post is extremely valuable for pointing out how the use of metagenomics pipelines can be actively misleading at identifying species reliably. I think this will be an extremely valuable teaching aid for the future. I also think Jonathan’s suggestion of a phylogenetic approach is an excellent one because these methods give you additional probability information that is useful (BTW Jon — you can recover counts by mapping reads back against your assemblies).
However, I think we can fairly confidently conclude that your study provides no compelling evidence of Y. pestis being on the subway. The missing part of this discussion is that we already have lots of understanding about the population genomics of Y. pestis and B. anthracis to guide us in interpreting these data. The most important thing to know is that these species are genetically extremely monomorphic, so matches at ~90% nucleotide identity simply cannot be from the same species.
Thanks Nick, and I would even go farther – even if a read matches 100% with Y. pestis, that is still not strong enough evidence – I think the reads are simply too short. For example, here are some reads from P00606 with a perfect match:
ACTATGGGTCGTCTGATTGGTATTGCGGCTCCGGCAGCAACAATGTCCTCTCCGGCCATTTCTTCCGCTGCAAAATCAGCTGCTGCTGAACTGCCAGGCTT
or
ATTGGTATTGCGGCTCCGGCAGCAACAATGTCCTCTCCGGCCATTTCTTCCGCTGCAAAATCAGCTGCTGCTGAACTGCCAGGCTTTGGCTCTATCACTGG
or
ATCCAGGGCTTTCTGGTAGCCGGCCGCCAGCTTACGCTGCGCATTTTCTTCCTTCCTCGCGGCACGCTGAGAAGCATTGGCAGTACGCTGCCCGGCTTTTT
But, according to BLAST, these are all also 1-3bp diverged from a number of other species such as Enterobacter cloacae strain 34399, or Salmonella phage SSU5 (noted similarities here http://www.ncbi.nlm.nih.gov/pmc/articles/PMC3911222/). So, I’m all about longer reads, more assembly, and phylogenetic analysis. Just short read mapping is truly not enough to be sure.
True, but if you perform de-novo assembly, assign taxonomic classification on longer reads which means that you can target the right phylogeny more precisely and then perform abundance mapping on the assigned contigs. Nonetheless a nice study it is!
Chris – thanks for the blog and the data. My group is currently looking at the B. anthracis and Y. pestis data and we’ll post anything that we find that adds to what has been said here.
Your work opens a dialog about how species are detected and called in metagenomic analysis. Tools like metaphlan and megablast are useful for rapid analysis, for comparing community composition between samples and for calculating abstract community measures like alpha diversity. However, they lack the resolution for very precise ascertainment of organisms, and in fact are a little dangerous when used this way.
The biodefense pathogens Y.p and B.a are particularly difficult. This is because they are very closely related to species that are less pathogenic and their virulence is dependent on horizonally acquired plasmids. These plasmids themselves are closely related to sequences found in non-pathogens but are also modular in that some parts of the plasmid can be highly conserved in another species, while other regions containing the key genes like lethal toxin are essentially only found in the nasty strains.
I think we probably need species-specific metagenomic detection tools for high consequence pathogens like Ba that incorporate the logic that have learned from the microbiology lab. As Jonathan said, phylogeny is important for accurate ascertainment. We also need to recognize that if we don’t detect the B. a chromosome but do find a plasmid 100% similar to pXO1 that is still a big deal. Also, we need to distinguish samples that contain sequences identical to the plasmid pXO1 backbone from those that also contain sequences 100% identical to the lethal toxin gene, for instance.
Chris – Thanks for taking the time to write this thoughtful & transparent follow-up to your team’s paper. I especially liked your statement “Going forward, the transparency of the methods, annotations, algorithms, and techniques has never been more essential.”
One methodological issue with broad relevance that I’d be interested to hear your thoughts on is the use of negative controls in metagenetic/metagenomic studies. I was encouraged to see that your team created 51 negative controls, but unfortunately only 13 were extracted and then analyzed only for total DNA yield. Given another recent round of ‘contaminomics’ papers (e.g., http://doi.org/10.1371/journal.pone.0110808, http://doi.org/10.1186/s12915-014-0087-z) it seems that bringing negative controls thought the entire process can provide invaluable ‘DIKW’ for distinguishing signal from noise (as in http://doi.org/10.1111/nph.12923). Do you have any thoughts on how negative controls can/should best be used? In my field (monitoring rare/elusive macrobiota with traces of extraorganismal DNA) we’re wrestling with these questions as we follow the lead from microbiome science.
One quick note on the demonstration of human demographics from environmental DNA: Kapoor et al. recently showed this is also possible using stream water in Cincinnati, Ohio: http://doi.org/10.1021/es503189g. Both of your studies raise fascinating questions about genomic privacy.
Congrats! You’ve been cited by the Megabiome (http://megabiome.net/2015/02/hungry-researchers-have-hard-time-replicating-subway-microbiome-study/)
I have made a storify of some of the responses on Twitter to this post
See https://storify.com/phylogenomics/chris-mason-post-at-microbenet-about-subway-study
[View the story “Chris Mason post at #microBEnet about subway study” on Storify]
This comments is from Maria Nunez who is having technical difficulties with commenting:
“Christopher, have you considered publishing a new paper with your last considerations? Many scientists do not have access to blogs/Twitter”
We have now posted our analysis of the data on github
http://read-lab-confederation.github.io/nyc-subway-anthrax-study/#mapping-metagenome-data-to-plasmids-and-chromosomes