This is just a quick posting of some building science data that I collected during Day 1 of the 4th Annual Conference on the Microbiology of the Built Environment in Boulder, CO. I setup a couple of our Open Source Building Science Sensors (OSBSS) in the front corner of the room before the conference convened yesterday and left them to log at 1 minute intervals throughout the rest of the day. I measured temperature, relative humidity, and CO2, although unfortunately I didn’t re-launch the T/RH logger after lunch so I wasn’t able to capture the unfortunate failure of the air-conditioning system. But below you’ll find CO2 measurements throughout the day.
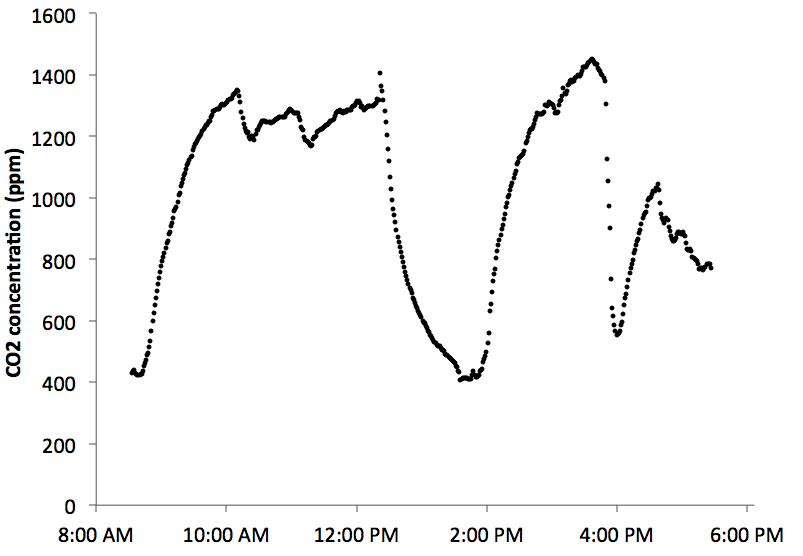
You can clearly see a steady rise of CO2 concentrations in the room once we all gathered for the 8:50 am start. For the duration of the morning, CO2 concentrations were pretty consistently hovering around 1200-1300 ppm. That’s not a terribly high level, but it is about 800-900 ppm above background (for some context on this value, you might be interested in reading this recent study on CO2 and decision making). You can also clearly see when we all left for lunch around 12:15 pm — CO2 concentrations decayed essentially down to the same levels as outdoor air, suggesting that there room was indeed left empty (or mostly empty). Then you again see a similar steady rise when we all return for the 2 pm session, followed by another break around 4 pm (notice how rapid the decay was during this period — remember when the hotel staff opened all of the exterior doors to help cool the space?). Finally, you see one last steady rise during the final session. These are pretty clear patterns.
We can also use these data to answer a question that I heard several people asking yesterday: when the AC failed and temperatures noticeably rose to some pretty uncomfortable levels, did the ventilation system also fail or did it keep operating?
I personally heard some fan noise continuing even during the AC failure, so I figured that the ventilation system was continuing to operate. Atila Novoselac figured the same in his presentation. And if you look at the afternoon data, CO2 concentrations largely stabilized around 1300 to 1400 ppm, which wasn’t much different from earlier in the morning. The ventilation system was most certainly still operating at approximately its same rate as in the morning even during the AC failure. That’s good to know.
We can also use these data to answer a couple more questions.
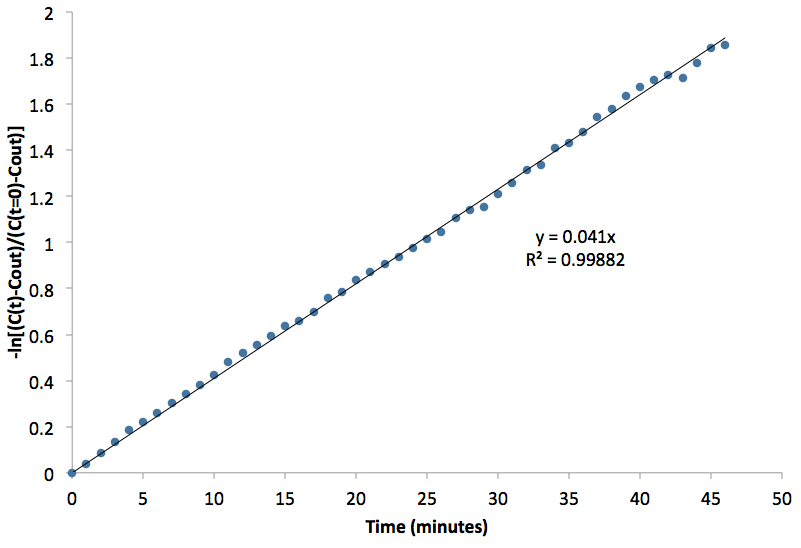
First, we can use data from the decay period during lunch when we all vacated the space and if we assume there were no significant sources of CO2 during that period (it doesn’t look like there were), we can calculate the ventilation rate during that period (and we can probably assume that the rate was constant throughout the day, although we can’t really confirm that as I’ll discuss more below). Below you’ll see a plot of the lunchtime decay period data, log-transformed to calculate a first-order exponential decay rate (this is a standard way to estimate ventilation rates). We get a pretty clean fit and an estimated air exchange of about 0.041 per minute or about 2.5 air changes per hour (2.5 ACH). That’s reasonably well ventilated (better than the portable classrooms we heard about yesterday), but lower than we’ve measured in other environments (such as in the Hospital Microbiome Project).
Finally, we can also attempt make a rough approximation of occupancy using the data we have at this point. We recently published a paper with Jeff Siegel at the University of Toronto detailing some ways to estimate occupancy, including using CO2 concentrations and knowledge of ventilation rates to back calculate the number of people in a room. It requires us to make some assumptions for per-person CO2 emission rates and to estimate the volume of the room. Estimates for CO2 emission rates vary depending on a number of factors, but a typical assumption is about 0.27 L/min. If we use this assumption, and if we estimate the volume of the room to be about 440 cubic meters (about 40 feet x 40 feet x 10 foot ceilings), and if we take 1300 ppm as the approximate steady state room CO2 concentration, and if we take 420 ppm as the approximate outdoor CO2 concentration (the minimum measured during the unoccupied lunchtime period), and finally, if we assume that the same ~2.5 ACH ventilation rate estimated during unoccupied periods applies for the occupied periods as well (a somewhat tenuous assumption), I estimate that there should have been about 60 people in the room throughout the morning sessions using these data. Unfortunately, that’s a pretty poor estimate. With a quick visual count today I estimate probably about 110 people are actually in the room (which is probably about the same as yesterday, give or take 10 people or so), so my estimate using CO2 concentrations alone is WAY off. My guess is that the ventilation rate may be controlled by an automation system based on occupancy rather than being constant throughout the day, but I’m really not sure at this point.
Regardless, hopefully these data help understanding a bit more about what’s going on in this very building!
UPDATE Jul 17, 3:45 pm
Jeff, Hal, and I just recalculated occupancy based on a different assumption for emission rates. If you use 21 g/hr per person (or ~10 L/hour or ~0.18 L/min) presented earlier by Allen Goldstein (and mentioned in the comment by Bill Nazaroff below) using recent measurements in a classroom (an environment probably quite similar to this conference room) instead of 0.27 L/min used previously, and you also keep all the other assumptions constant, you get an estimated occupancy of about 91 people. That’s a whole lot closer to the observational count from today. As Bill Bahnfleth mentioned below as well, other differences might be explained by non-uniform mixing issues among other things.
Great post. One comment: The estimates of occupancy are heavily based on emission rate. See Figure 7 of Dedesko et al (2015) Bldg. Environ. Hal Levin is doing lots of great stuff on metabolic rates and how far off we are when we base things on data from the 50s and 60s when people were less fat. If you think about the conditions in the room yesterday afternoon (hot and humid), I have no doubt that your per person CO2 emission rate is off pretty considerably.
Nice post. But I’m wondering about the CO2 generation rate.
Have you factored in the altitude of Denver? (As a side note, I find it more useful to think about metabolic CO2 emissions in mass per time per person, rather than volume per time. Metabolism should link directly to mass of C oxidized, so the mass emission rate should be closer to stable regardless of room temperature or pressure.)
You’ll see later today in Allen Goldstein’s presentation that we measured 21 g/h per person as the CO2 emission rate in a classroom setting. That’s lower than the standard average emission rate. The classroom and the MoBE setting are probably similar regarding metabolic processing.
Totally agree. Funny — check out our new estimates based on Allen’s data…
Non-uniform CO2 concentration could also lead to an underestimate in population. With CO2 sensors in unoccupied front corners near supply diffusers, the concentration at the sensor location may have been lower than the room average.
Definitely — good point, Bill.
Nazaroff raises good questions, a usual.
Altitude in Boulder is roughly 1650 m. My Kestrel 4200 is reading 1608 m right now, but I have not calibrated it to account for an relevant variables.
“At 1650m, the standard barometric pressure is 84 kPa (630 mmHg). This means that there is 83% of the oxygen available at sea level. ” http://www.altitude.org/why_less_oxygen.php
At an RQ (CO2/O2) exhalation/inhalation relationship of 0.83 to 0.85 (depending on diet), the exhaled CO2 is about 2/3 (0.83 * 0.83) of the inhalation rate (assuming no change in inhalation as a function of altitude – probably not a perfectly correct assdumption).
updated met rates (updated from the commonly-used values) are summarized on https://sites.google.com/site/compendiumofphysicalactivities/
I would estimate the met rate of the participants in the Sloan MoBE symposium at about 1.4 to 1.6.
I have and will make available upon request my calculations of CO2 generation rates as an Excel file based on the the general change from the old, commonly used values is an increase of about 15 to 25% based on the usual calculation methods using the DuBois body surface area calculation and updated human size data available in the 2011 EPA Exposure Factors Handbook which for the first time includes values for young children. I have tabulated CO2 gen rates at 1.2, 1.6, and 2.0 met, the normal values encountered in most indoor environments not intended for exercise or athletic events or heavy work. (Don’t forget to correct for altitude, as Bill has suggested.)
Note the slope of Brent’s curves indicate that conditions in the room did not reach steady state, the condition required to use the usual equations to calculate ventilation rate per person from CO2 concentration data. This is normal; it is an uncommon situation where steady state conditions are achieve other than in a bedroom during most of the night.