There are a number of cases where determining the relationship between microbes is at the center of a research question. Are the microbes inhabiting a building the same as those inhabiting its tenants? Are the microbes in a hospital room the same as those that colonize newborn babies? Is the E. coli living on a wood surface the same as the E. coli living on a plastic surface?
The most common metric of comparing sequenced microbial genomes is average nucleotide identity (ANI)1. The basic idea is to align two genomes and count the number of mismatches in the alignment. Genomes with an ANI of 99% have 1 mismatch between them every hundred bases, whereas genomes with an ANI of 95% have five mismatches between them every one hundred bases, and so on. There are numerous methods to calculate average nucleotide identity, with the major difference being the algorithm used to align the genomes.2–4
Through calculating the ANI between genomes in a number of systems, some loose and general ANI breakpoints have been documented:
- < 96% ANI = Same 16S cluster (using standard 97% clustering)5
- > 96% ANI = Same bacterial species4
- > 98% ANI = Same E. coli clade6
- > 98.8% ANI = Same Prochlorococcus clade7
- > 99.9% ANI = Same K. pneumoniae outbreak strain8
At which ANI threshold it becomes appropriate to call genomes the “same” depends on the research question. If the question is whether the microbes in an office in Flagstaff are the same as those in an office in San Diego, two microbes of the same species should probably be considered the “same,” and thus an ANI of 95% (or 16S sequencing) would adequately address the question (and it did; Chase, 20169). If the question is whether microbes in two different body sites came from the same source, 95% ANI is too low. Just because E. coli is on two body sites doesn’t mean they came from the same place; one strain could have come from the soil and the other strain from the neighbor next door. An ANI above 95% is definitely needed to show both strains come from the same source, but how high of an ANI is needed is another question (99.9% ANI was used to address this in a recent publication; Olm, 201610).
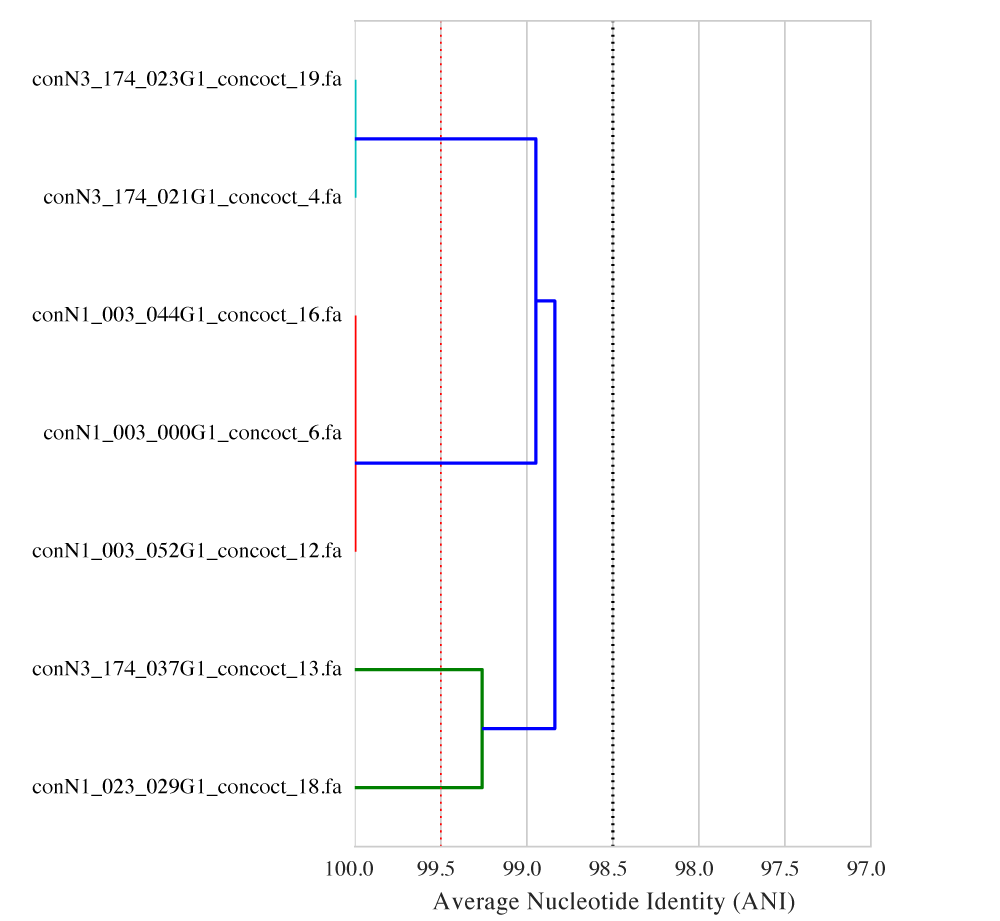
When picking an ANI threshold for a specific question it is often helpful to visualize the relationship between the genomes. dRep, a python program recently published on bioRxiv11, was written to do just that. For example:

The figure above shows the ANI between strains of Streptomyces inhabiting different babies in the same NICU in Pittsburgh. From the figure, you can see that the ANI between conN3_174_037G1_concoct_13 and conN1_023_029G1_concoct_18 is about 99.25, the ANI between conN3_174_023G1_concoct_19 and conN3_174_021G1_concoct_4 is about 100, and so on. The figure also makes it clear that different ANI thresholds will result in different conclusions about which babies have the “same” strains. For example, calling genomes the “same” if their ANI is >= 98.5% (as shown at the dotted black line) will result in the conclusion that there is only one single strain of Streptomyces that all babies share. Calling genomes the “same” if their ANI is >= 99.5% (as shown at the dotted red line) will result in the conclusions that there are 5 different strains of Streptomyces, two of which (conN3_174_037G1_concoct_13 and conN1_023_029G1_concoct_18) are only in one infant. In this example changing the ANI threshold by a single percentage point completely altered the conclusions drawn from the data, highlighting the importance of selecting a threshold carefully.
dRep, the program used to compute the ANI and generate the above figure, was recently published on bioRxiv.11 Documentation is available on ReadTheDocs, and the source code is available on GitHub. dRep cannot tell you which ANI threshold is appropriate for your specific application, but it can produce figures like the one shown above to help guide the decision.
References
1. Konstantinidis, K. T., Ramette, A. & Tiedje, J. M. The bacterial species definition in the genomic era. Philos. Trans. R. Soc. B Biol. Sci. 361, 1929–1940 (2006).
2. Goris, J. et al. DNA-DNA hybridization values and their relationship to whole-genome sequence similarities. Int. J. Syst. Evol. Microbiol. 57, 81–91 (2007).
3. Richter, M. & Rosselló-Móra, R. Shifting the genomic gold standard for the prokaryotic species definition. Proc. Natl. Acad. Sci. 106, 19126–19131 (2009).
4. Varghese, N. J. et al. Microbial species delineation using whole genome sequences. Nucleic Acids Res. 43, 6761–6771 (2015).
5. Kim, M., Oh, H.-S., Park, S.-C. & Chun, J. Towards a taxonomic coherence between average nucleotide identity and 16S rRNA gene sequence similarity for species demarcation of prokaryotes. Int. J. Syst. Evol. Microbiol. 64, 346–351 (2014).
6. Luo, C. et al. Genome sequencing of environmental Escherichia coli expands understanding of the ecology and speciation of the model bacterial species. Proc. Natl. Acad. Sci. 108, 7200–7205 (2011).
7. Kashtan, N. et al. Single-cell genomics reveals hundreds of coexisting subpopulations in wild Prochlorococcus. Science 344, 416–420 (2014).
8. Snitkin, E. S. et al. Tracking a hospital outbreak of carbapenem-resistant Klebsiella pneumoniae with whole-genome sequencing. Sci. Transl. Med. 4, 148ra116–148ra116 (2012).
9. Chase, J. et al. Geography and Location Are the Primary Drivers of Office Microbiome Composition. mSystems 1, (2016).
10. Olm, M. R. et al. Identical bacterial populations colonize premature infant gut, skin, and oral microbiomes and exhibit different in situ growth rates. Genome Res. gr-213256 (2017).
11. Olm, M. R., Brown, C. T., Brooks, B. & Banfield, J. F. dRep: A tool for fast and accurate genome de-replication that enables tracking of microbial genotypes and improved genome recovery from metagenomes. bioRxiv (2017). doi:10.1101/108142

The article sounds scientific …….thoughtful work