The Knight lab has been working hard testing new primers for 16S rRNA amplicon production and its time to share our progress.
So far, the 16S rRNA V4 region forward primer (designated 515f) has been paired with five different reverse primers (806r, 926r, 967r, 1048r, and 1391r) to amplify ribosomal RNA from bacteria, Archaea, and Fungi. Thanks to Jed Fuhrman and Amy Apprill, the 515f and 806r primers have also been modified, helping minimize the amplification bias against Crenarchaeota/Thaumarchaeota (515f) and SAR 11 (806r). All primer pairs have successfully yielded PCR amplicons, and the amplicons from the 515f/806r and 515f/926r constructs sequenced. The remaining primer pair constructs will be sequenced soon with an update to follow once we have the results.
The differences between the old and new 515f nd 806r constructs are described below:
Original 515f construct / modified construct (Jed Fuhrman, C to Y base change on the 5’ end)
5′-GTGCCAGCMGCCGCGGTAA-3′ / 5′-GTGYCAGCMGCCGCGGTAA-3′
Original 806r construct / modified construct (806rB, Amy Apprill, H to N base change mid-primer):
5′-GGACTACHVGGGTWTCTAAT-3′ / 5’-GGACTACNVGGGTWTCTAAT-3’
Why the new constructs, you ask? And what does the added degeneracy mean?
- The barcodes, which were previously located on the reverse primer, are now located on the forward (515) primer. This enables the user to pair the forward primer with various reverse primer constructs to enable longer amplicons. We’ve tested the barcoded 515f primer with 806r and 926r. Importantly, the barcoded constructs were screened in silico for secondary structure against a number of longer constructs (967r, 1048r, 1391r). We have tested the performance of these constructs in PCR but have not validated the results on the MiSeq or HiSeq platforms.
- The degeneracy was added to the forward and reverse primers to minimize the bias against Crenarchaeota/Thaumarchaeota (515f modification) and the marine and freshwater alphaproteobacterial clade SAR11 (806r modification)
To compare the new primer constructs to the old ones and thus confirm the performance of the new constructs, we sequenced amplicons produced from both constructs applied to a number of studies. Our intent was to sample a wide range of sample types to confirm that the new primer constructs produce data comparable to that obtained using the old constructs on a variety of sample types. The studies/sample types that the constructs were tested on are:
-5 American Gut fecal samples
-5 American Gut skin Samples
-5 Body farm control Soil samples
-6 Body farm paired skin/soil samples
-33 Sloan house samples (various sites)
-15 Mouse decomposition control soils
-9 Rice Rhizome samples
-12 Agricultural soil samples
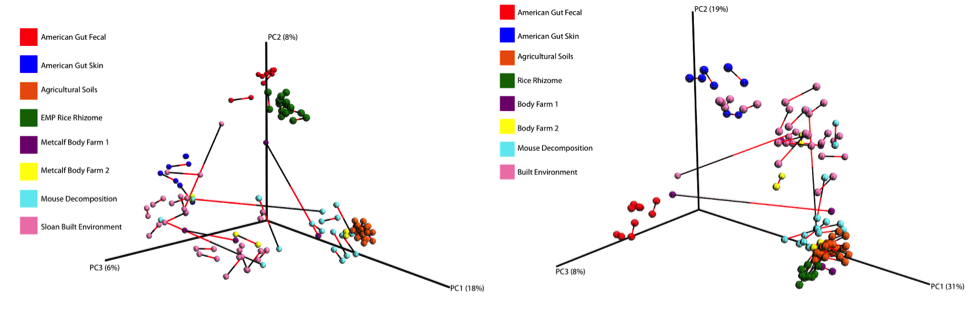
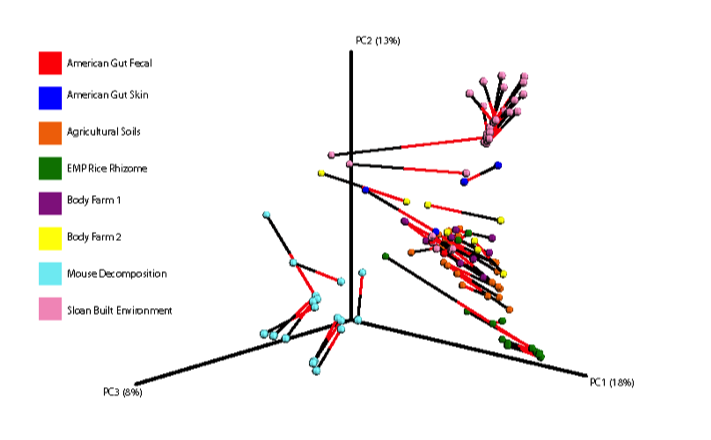
Below is a procrustes plot (using the unweighted UniFrac distance matrix on the left and the weighted UniFrac distance matrix to take into account taxa abundances on the right) comparing samples amplified using the original primer construct and the new, modified primer construct. The calculated M2 value for the unweighted UniFrac based plot is 0.111 and for the weighted UniFrac based plot is 0.196. With the exception of a few mouse decomposition and built environment samples, each sample produces extremely comparable results between the old and new primer constructs. Importantly, very commonly studied sample types (stool, soil, skin) perform very well under the new constructs.
Overall abundance comparisons at various taxonomic levels are shown in the pie charts below. For the purposes of clarity, low abundance taxa (less than 0.01% relative abundance) were removed before generating these charts.
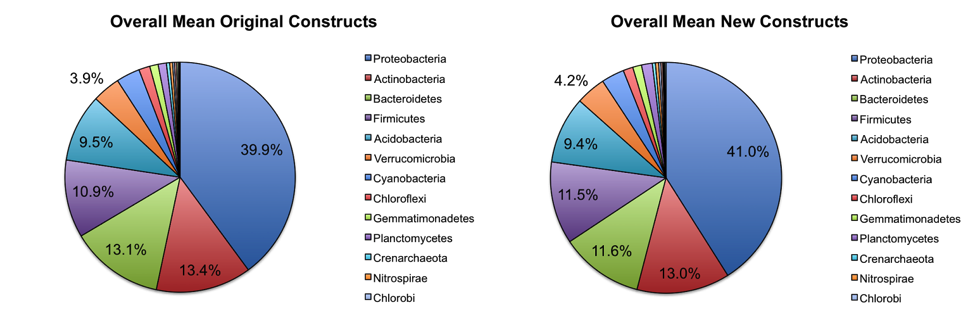
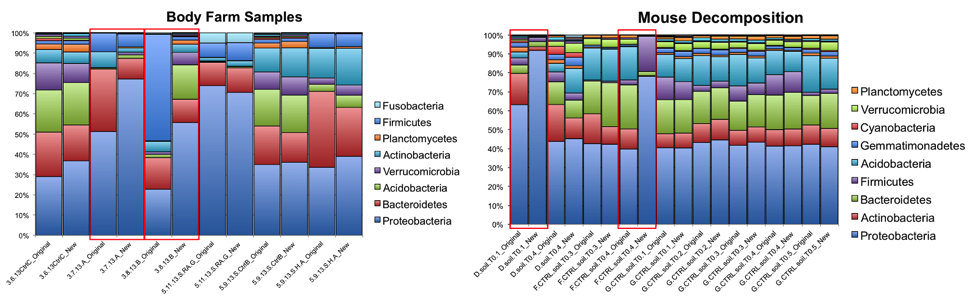
At the phylum level, the relative abundances of the major taxa present in the dataset vary at most by 2.5% (Bacteroidetes) between the old and new primer constructs. Importantly, the ratios between various taxa follow the same trend, indicating that the new constructs perform similarly to the old constructs. Four sample pairs (a total of 8 samples out of 86 samples tested) did not perform identically between the two constructs: one pair of mouse decomposition samples and one pair of human decomposition (body farm) samples. The taxonomic composition of these sample pairs varies greatly (see taxonomy plots below), with no obvious patterns. Importantly, these samples do not look like samples of the same type typically look. Together, these observations suggest that the issue is likely not due to the new primer constructs. We hypothesize that the difference could be due either to sample mislabeling or to the fact that some sample DNA became depleted as we tested multiple primer constructs; however, we cannot confirm or refute this hypothesis. Nevertheless, we feel confident concluding that the new primer constructs perform comparably to the old constructs, producing data from which comparable conclusions can be drawn.
The R2 values for each taxonomic level for each sample type/study, with the “outlier” mouse decomp and body farm samples removed, are listed below, followed by the corresponding per-taxon scatter plots (genus level).
|
AG fecal |
AG skin | Agricultural Soils | Rice rhizome |
Body farm 1 |
Body farm 2 |
Mouse decomp | Sloan built environment (house) | |
| Phylum |
0.9780 |
0.8833 | 0.9546 | 0.9799 | 0.8630 | 0.9172 | 0.9075 | 0.9148 |
| Class |
0.9434 |
0.8283 | 0.8613 | 0.9398 | 0.5579 | 0.8982 | 0.6658 |
0.8532 |
| Order |
0.8414 |
0.8928 | 0.9178 | 0.8291 | 0.2961 | 0.6644 | 0.6460 |
0.8148 |
| Family |
0.9392 |
0.7712 | 0.9270 | 0.8942 | 0.6181 | 0.8454 | 0.7769 |
0.8161 |
|
Genus |
0.9400 | 0.7914 | 0.9082 | 0.8466 | 0.5092 | 0.8690 | 0.6794 |
0.8033 |

Overall, the modified primers perform comparably to the old primers, especially when applied to commonly studied samples (soil, skin, feces, and even the built environment). We are confident that the vast majority of researchers who have been using the old constructs can transition to the new constructs without issue.
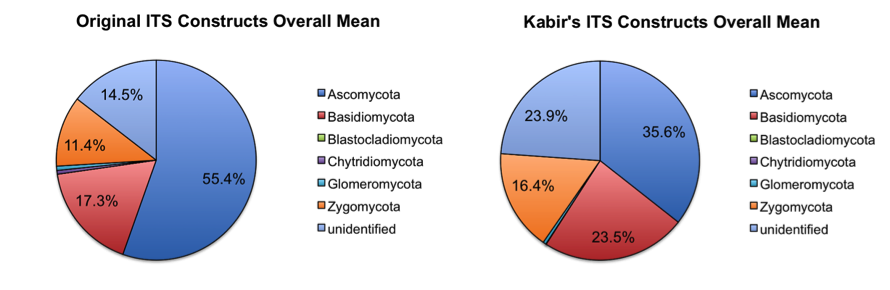
Additionally, we have tested (on the same studies mentioned above) and will send out ITS1 spanning constructs based upon the constructs by Smith and Peay (Smith DP & Peay KG (2014) Sequence Depth, Not PCR Replication, Improves Ecological Inference from Next Generation DNA Sequencing. PLoS ONE 9, e90234; For prior constructs, see ITS1F and ITS2 primers from table 1 of: Op De Beeck M, Lievens B, Busschaert P, Declerck S, Vangronsveld J & Colpaert JV (2014)). The new constructs gave improved yields compared to the old constructs (similar results with initial demultiplexing/quality filtering, but approximately 2X the number of reads clustering against the May 2014 release of the UNITE database). This appeared to impact the overall taxon abundances achieved with each primer construct, as seen in the taxonomy plots below (low abundance taxa (less than 0.01% relative abundance) were removed before generating the plots).
Importantly, even though the relative abundances varied greatly in some cases between the two primer constructs, the overall clustering patterns of specific sample types remained the same, as seen in the procrustes plot (produced from the Bray-Curtis distance matrix) below.
The R2 values for each taxonomic level for each sample type/study are listed below, followed by the corresponding per-taxon scatter plots (phylum and genus level).
*Note-rare taxa were filtered out of the dataset before R2 values were calculated.
|
AG skin |
Agricultural Soils |
Rice rhizome |
Body farm 1 |
Body farm 2 |
Mouse decomp |
Sloan built environment (house) |
|
| Phylum |
0.6305 |
0.9017 | 0.9246 | 0.9018 | 0.9030 | 0.9245 |
0.7647 |
| Class |
0.2746 |
0.6466 | 0.9389 | 0.5678 | 0.3587 | 0.6212 |
0.5092 |
| Order |
0.6538 |
0.6331 | 0.9334 | 0.6620 | 0.5356 | 0.4103 |
0.4808 |
| Family |
0.7219 |
0.7005 | 0.8828 | 0.4942 | 0.5281 | 0.4509 |
0.5918 |
| Genus |
0.4990 |
0.7084 | 0.8884 | 0.7411 | 0.3767 | 0.3560 |
0.4033 |
The R2 are higher in sample types expected to have a considerable amount of fungi present, such as agricultural soils, rice, and decomposition.

The performance of the new ITS1 spanning primer constructs compared to the old constructs varies depending on the sample type. Samples expected to possess a considerable fungal community (soil, rice, decomposition to some extent) perform more similarly between the two primer constructs. Importantly, the new constructs are more successful in that a larger number of reads produced through these constructs align against the UNITE fungal database, suggesting that the new constructs will be a good tool for researchers to characterize the fungal microbial communities present in their datasets. However, some researchers will need to take care when comparing datasets amplified using the different constructs, as their comparability depends on sample type and on the biological effect size of the phenomenon under investigation.
It is very important that these new constructs not be mixed and matched with the old constructs (reverse barcoded V4) in a single Illumina run, as this can lead to double priming and run failures. As observed by Chris Wright at the University of Illinois, the best results are obtained when sequencing samples on their own HiSeq Rapid Flowcell (2 lanes) or on an entire MiSeq run (1 lane).
We are quite excited about the current work on these primers, which should greatly increase the PCR amplification options available to microbiome researchers working in a variety of environments, including the built environment.
I would like to thank Tony Walters, PhD, and Greg Humphreys for their help in generating the data for this blog post. Many thanks also to Jed Fuhrman, Amy Apprill, Janet Jansson, Jack Gilbert, and of course, Rob Knight, for input, comments, and hard work producing the data.
Does anyone have an idea on how the 515F mismatch might bias samples that are heavily populated with Crenarchaeota (e.g., hot spring biofilms/sediments)?
Comment from Twitter by Paul Costea
Thanks for sharing this Jonthan. I’d like to point out to all reading that the biases that are avoided with the new primers pertain to taxa that are not commonly found in the sample types studied here (i.e. stool, skin, built environment) but in marine environments and environments such as hot springs. The idea, therefore, is-for those studying these environmental types, these primers should give more trustworthy resutls; for those not studying these environmental types but sticking to the more “normal” microbiomes, these primers provide very similar results. This is important as ongoing studies that were started on the original primer sets will not have to be completely rehauled if the investigators switch to the new primers.
Of course the point that the new primers perform similar to the old ones in general is an important one to make and you have made it splendidly. However, the fact that these primers fix amplification biases remains nothing more than an assertion (unless i’ve missed something). Thus, the proof of similar behavior is actually proof of redundancy.
I’m sure you will produce data showing that there is a considerable improvement in unbiasing (not sure this is actually a word) marine environment samples and then everything falls nicely into place. I was just pointing out that there’s a rather important bit of the puzzle missing.
Ah, yes, of course. You haven’t missed anything-and thank you for your criticism. We much rather have skeptical, constructive criticism than blind faith.
Very few of the samples that we tested did have low levels of Crenarchaeota/Thurmarchaeota, though unfortunately these two taxa were not present in the majority of the samples tested (or at high abundances) in the study described here and thus I opted to omit these results from the overall discussion.
The overall average Thaumarchaeota abundance in this dataset with the old primers was 0.405%, while the overall average was 0.436% (an increase, albeit small). The overall average SAR11 abundance in this dataset with the old primers was about 3-5% (among three samples), while this percentage increased to 5-8% (among the same three samples) with the new constructs.
So, as you can see, a more optimal dataset with inherently higher levels of these taxa would be nice; however, with the limited data available from the datasets tested, we do see rectification of the old primer bias against these two taxa.
Thanks for your questions!
Hi, the change in the primer 515F has been published in 2009 (primer 515-532: http://www.plosone.org/article/fetchObject.action?uri=info:doi/10.1371/journal.pone.0007401&representation=PDF). The difference between both is that the one presented by Wang and collaborators lacks the last base “A”
Hi Inessa,
Thanks for your comment! The modified 515f primer described in this post was recently described, tested, and published here: http://www.ncbi.nlm.nih.gov/pubmed/26271760
The modified 806r primer described in this post were recently described, tested, and published here: Apprill a, McNally S, Parsons R, Weber L. 2015. Minor revision to V4 region SSU rRNA
346 806R gene primer greatly increases detection of SAR11 bacterioplankton. Aquat Microb
347 Ecol 75:129–137.
A manuscript based on this blog post has been submitted and should be out soon. Note that this post was written before any of the literature in preparation had been published. It is important to note that these are brand new modifications implemented to specifically address biases against Thaumarchaeota/Crenarchaeota and SAR11.
Dear, Embriette Hyde, thank you for your response.