
Week 4: Osmolarity Growth Curves
We started class by taking out the dilution streak plates that the students made in Week 3. We learned two things from this as instructors: (1) We did an amazing job teaching the technique for dilution streaking – all of the plates turned out beautiful! (2) We did not do an amazing job teaching sterile technique – about half of the plates had contamination on them. So, we spent a few minutes demonstrating the basics of sterile techniques such as pipetting liquid from a tube at an angle, what surfaces to sterilize, and how to minimize the time containers are open, etc.
Students then performed another round of dilution streaks from the previous plates. In Week 5, we discovered far less contamination on their plates, so we can assume our discussion about sterile technique was helpful.
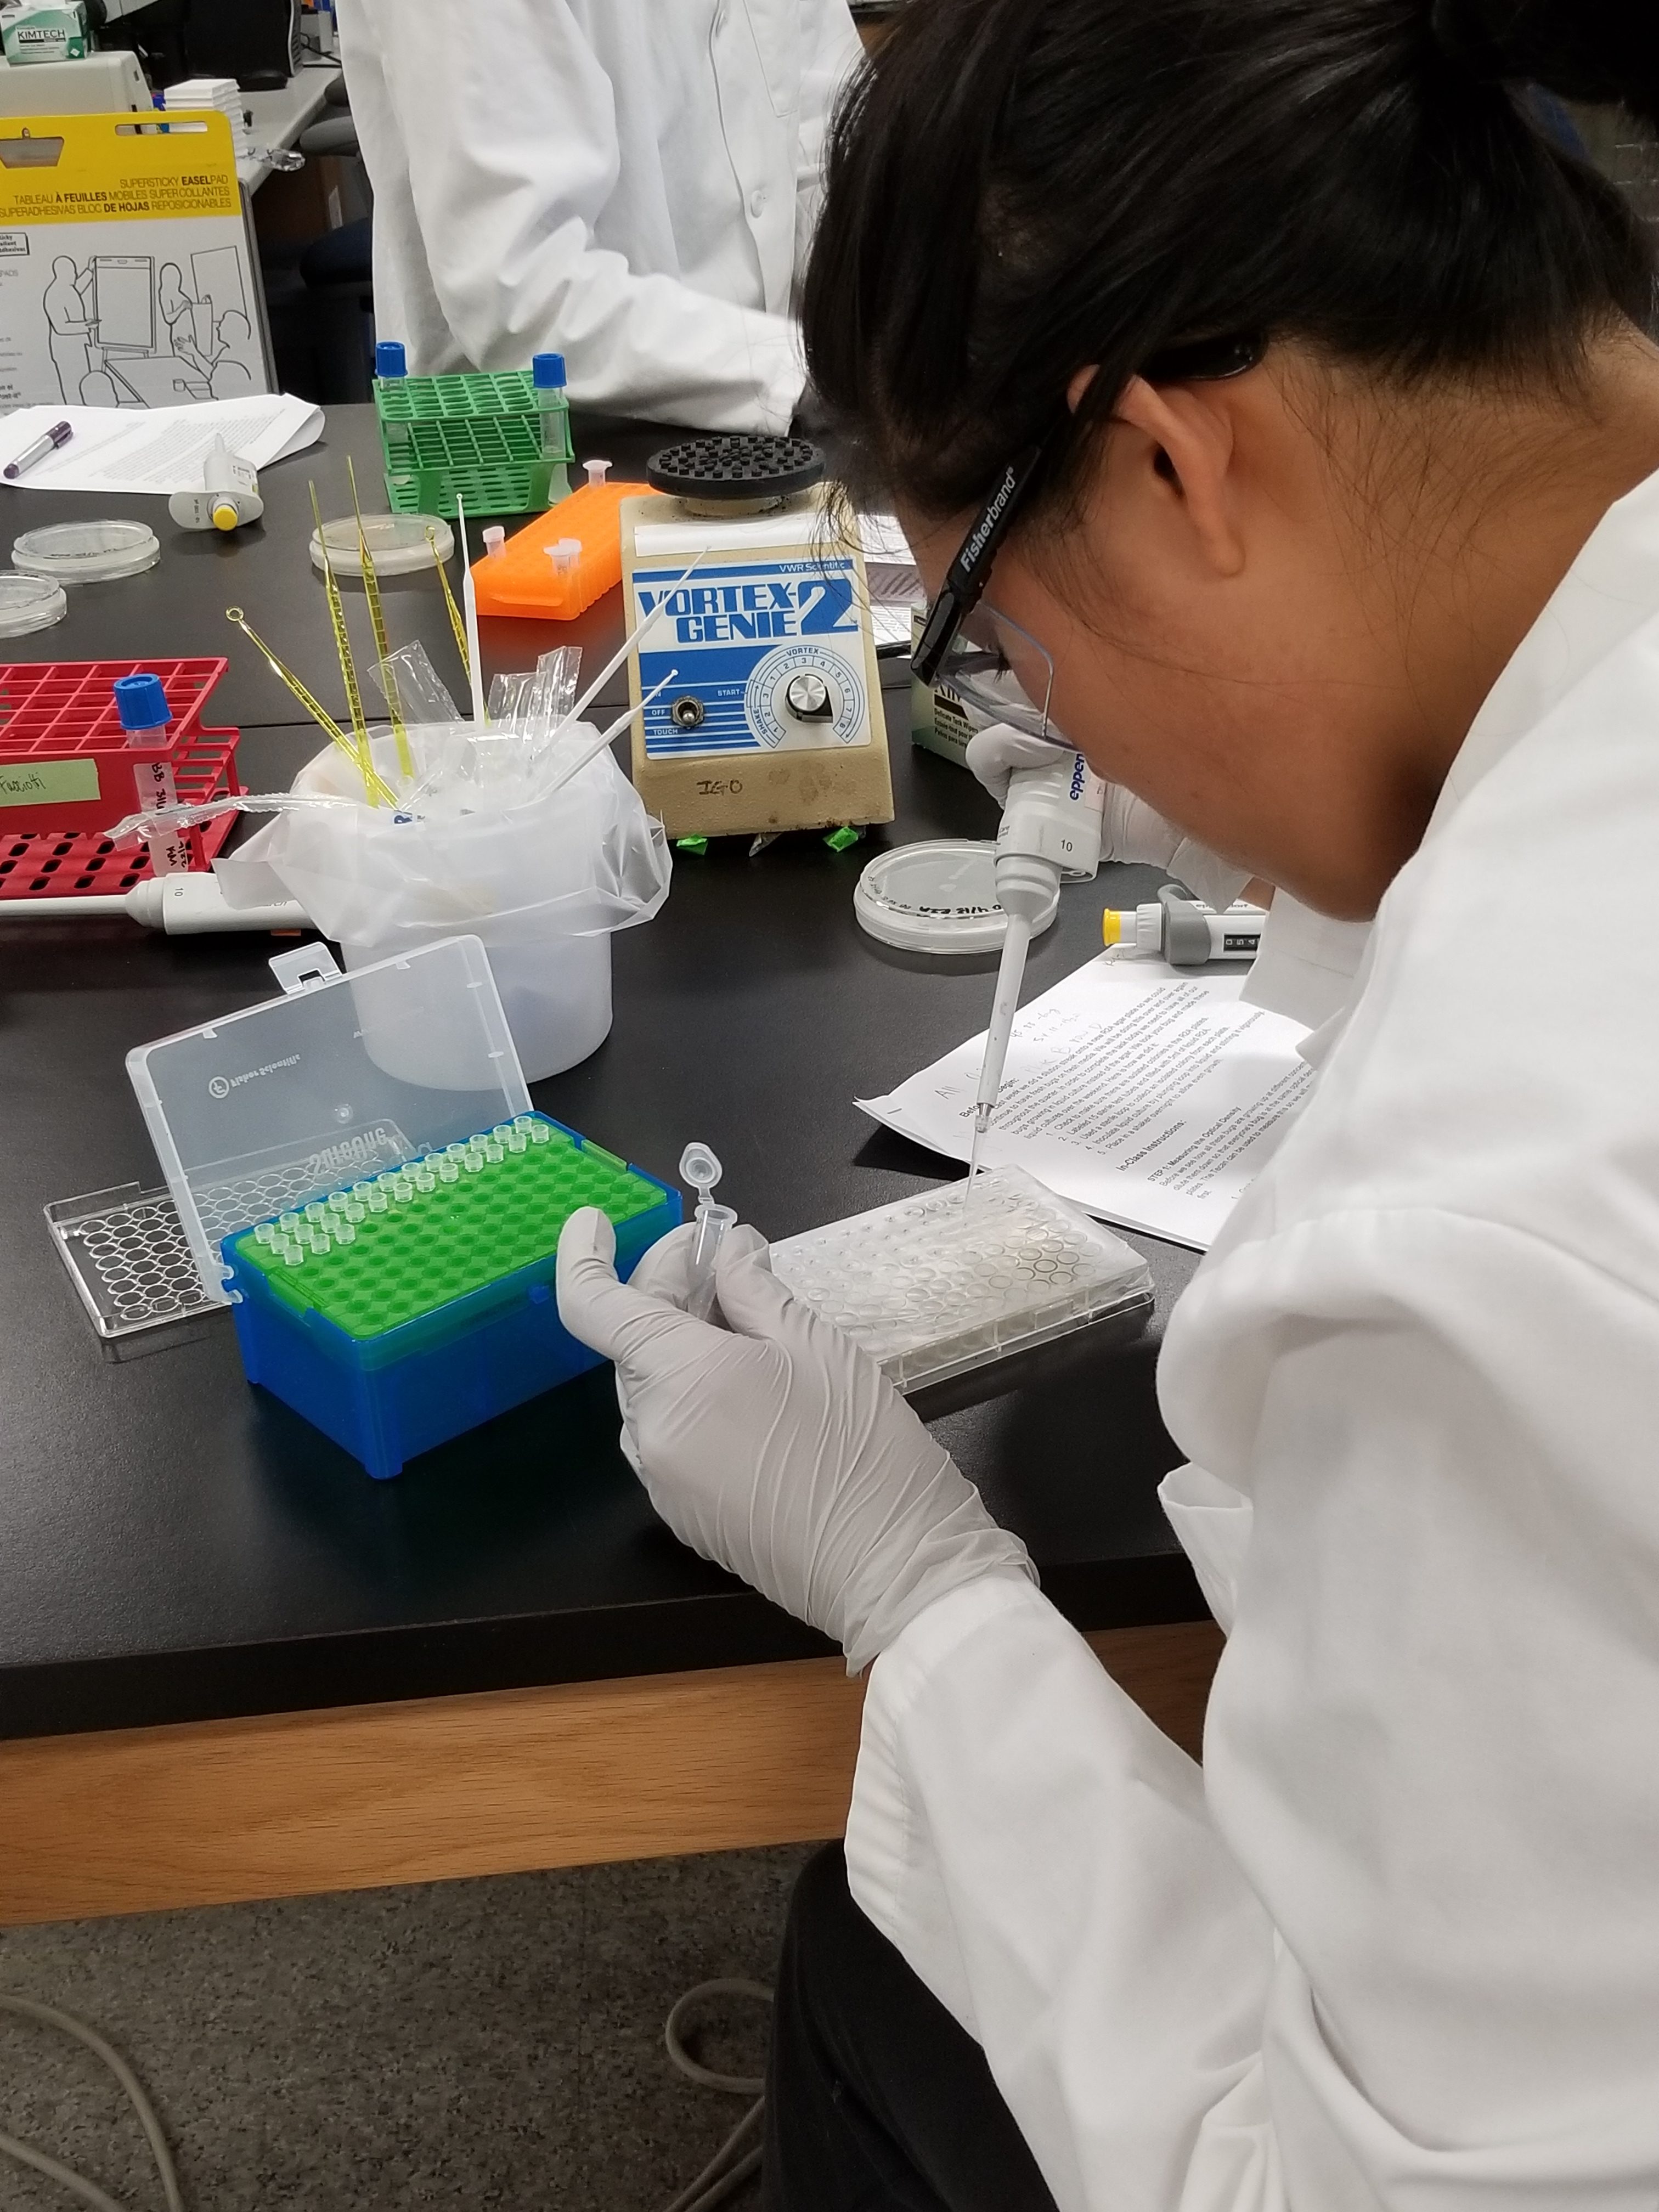
Next came time for the first growth kinetics experiment. There was a non-trivial amount of work that went into making this possible for class. Kaylah and Emily made liquid media cultures of each student’s bug. They also pre-loaded three 96 well plates, organized such that each student would use an entire row for their experiment. Each row consisted of four different osmolarity concentrations (1.5%, 5%, 15%, 30%), in triplicate, ready for students to just add 2ul of their diluted liquid culture.
As a note to others planning on conducting growth experiments, there was obvious bottleneck with 16 students loading 12 samples into only 3 plates. We budgeted a lot of time
for this and we were glad we did! We were also concerned about cross-contamination in the wells, so we covered them in parafilm and had students puncture the film when they loaded each well. This worked really well! Also of note, we then replaced the parafilm with the 96 well plate lid because the parafilm was not clear enough to be compatible with the plate readers that we used.
An equipment limitation that we had was having 3 plate readers available for all of the students’ growth experiments. We were able to combine resources with other labs to make this possible, although it did result in 3 different formats of data output. The experiment ran for 96 hours, so there was no way we could use one plate reader for the class.
Week 5: Growth Curve Analysis
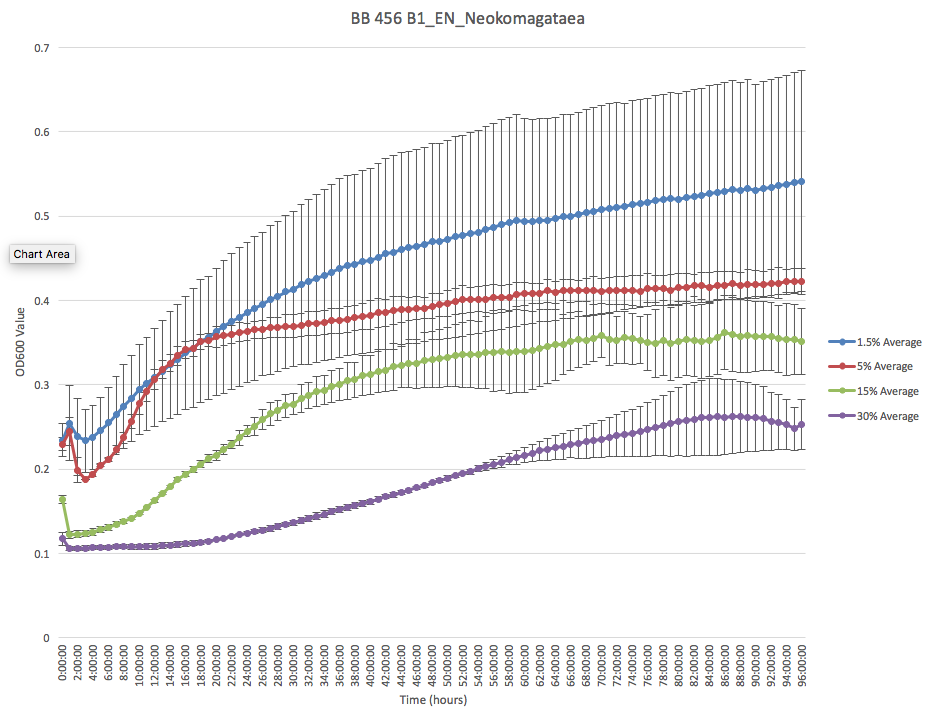
I have included a few examples of the results of this experiment, which students spent Class 5 analyzing. We had students dilute their media culture to be the same, but the growth curves show that we either needed more time or more input material. I’ve included the worksheet that students used for the “Data Day of Suffering”. For this, we required students to use Excel (free to UC Davis students) because you can not add custom standard deviation error bars into a graph in Google Sheets.
Term Project Update:
Students continued to develop the worksheet mentioned in Week 3, as well as expanding on the narrative to go along with their group’s figure. An example of the relatively completed version of this process will be provided in the next blog post.