Introduction
In 2013-2014, a metagenomics project called “Pathomap” collected 1,457 swab samples from the surfaces of all active subway stations throughout New York City (NYC), as well as samples from the Gowanus Canal and several parks. Each sample was sequenced to an average depth of 3.6 million reads (paired-end 125 nucleotides), generating a city-wide metagenomic profile that was published earlier this year. The aim of this study was to comprehensively map the metagenome of a dense, shared urban environment and establish a baseline of city-scale genetic diversity, which is a prerequisite for using metagenomic sequencing to actively monitor city-scale biological changes. These kind of maps represent the rise of a “digital immune system,” which is necessary to model normal background diversity and to help make “smart cities.” This work is now being replicated across more than 40 cities around the world, in a coordinated effort called the Metagenomics and Metadesign of Subways and Urban Biomes (MetaSUB).
However, the NYC study had some surprising findings of putative pathogens, including anthrax, and a detailed analysis of these results can inform future studies. To avoid false positives, pathogenic species were only called if they were detected by three well-known computational methods: MEGAN, MetaPhlAn2, and SURPI. All three methods reported the presence of B. anthracis DNA in two NYC subway samples (P00134, P00497) – a highly unlikely result considering that anthrax is exceedingly rare in NYC, and the few cases that have occurred in or near NYC were proven to be caused by specific exposure events not connected to the NYC environment (amerithrax, drum isolate}. This led to a follow-up study by the authors, members of the DOH/CDC, and Tim Read’s group (Petit et al., 2015). A recurrent theme among the follow-up work is why, and how, such pathogens may be detected and the potential sources of error. One large factor is simply incomplete databases, which can lead to false-positive errors when a novel sequence is encountered and incorrectly assigned to the nearest known species. Also, follow-up work demonstrated low evidence for other genetic markers of B. anthracis (plcR, pX01, pX02), but still the presence of fragments of DNA unique to B. anthracis. The observed species-specific genetic fragments are the reason these algorithms predicted the presence of B. anthracis, but clearly more context is needed in such cases to make the distinction between a species/genus that might be pathogenic versus an actual, likely pathogen.
Thus there is a need for new methods to carefully investigate the weight of evidence for species-specific fragments of DNA of k-nucleotides (k-mers) and also to leverage known, species-defining phylogenetic markers for metagenomic data analysis. This is most paramount for putative infectious agents or those on the bioterrorism watch list or Select Agents list. B. anthracis makes an excellent case study in “taxonomic forensics,” since it shares many closely-related relatives, which makes its classification difficult, but also clear genetic markers that define its virulence. To aid these efforts, here we present a new, free, online tool that has been developed with One Codex that can rapidly and accurately discern the presence/absence of B. anthracis in a metagenomics sample, even in complex mixtures.
Taxonomic Forensics with k-mer hunting
For a detailed analysis, we considered the two PathoMap NYC subway samples that tested positive for B. anthracis from MEGAN, MetaPhlAn, and SURPI metagenomic algorithms. For the original PathoMap analysis, 3,386,006 and 4,583,408 million 125 bp paired Illumina sequencing reads were generated from samples P00134 and P00497. We first investigated what happens to the composition of a sample (P00497) when sequenced to higher depth (241 million reads vs. 4.5 million). After read cleaning and mapping to the known RefSeq databases, we calculated the species present. Notably, the proportion and quantification of species was almost identical for P00497 (Figure 1), even when almost two orders of magnitude higher in depth, and this was true at both the species (right) and genus (left) taxonomic levels.
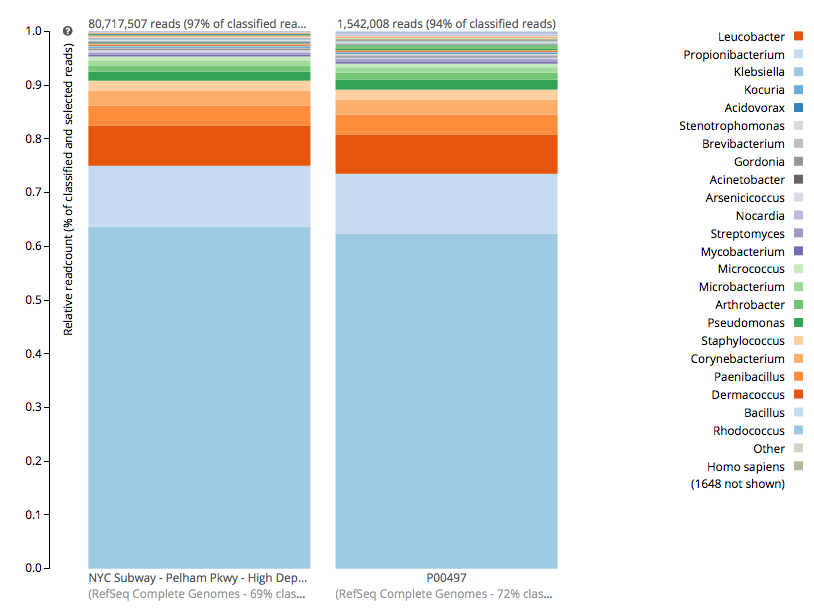
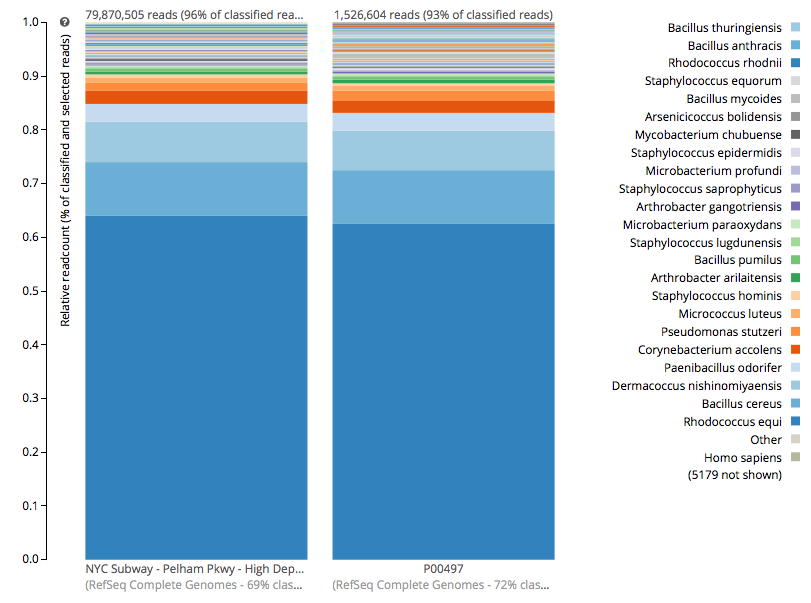
Figure 1 – Species detection as a function of depth for a subway metagenomic sample. Taxa detected from Refseq are shown by genus (left) and speices (right) using the One Codex online interface.
Interestingly, the normalized abundance estimates from MetaPhlAn of B. anthracis increased from the deeper-sequenced sample, from 0.112% to 0.147%, indicating that the detection at low sequence depth was not just a sampling error. However, the question is context – how do these genetic markers of Bacillus compare to known genetic markers of B. anthracis, and also to the general markers across the genus? For this question, we used the One Codex tool to tease out these differences, which contains all the 31-mer genetic markers for Bacillus species (including anthracis) and can plot the detection and abundance of these markers. Fortunately, we can clearly delineate the B. anthracis markers from the general Bacillus markers, even when the increased sequencing depth shows higher abundance of these markers (from 1/1605 markers to 12/1605 markers). Importantly, these anthracis markers increase in a linear fashion with depth, but along with the other Bacillus markers. Also, the tool plots the genetic markers of B. anthracis (plcR, pXO1, pXO2) and plots how many of them are found. You can go to the plot and play with the data and see the underlying data for each data point, which is interested to see what happens we use titrated mixtures of various Bacillus species:
The raw code, methods, and data processing steps for the analysis are all open-source and posted on GitHub, and the tool is free to use. The detailed analysis of these samples are also presented in a complete paper here. The exciting result is that this tool lets us discretely tease out the the presence of a real B. anthracis in a sample, and it can help any future sample that shows such a result. Thanks especially to Sam Minot and Nick Greenfield from One Codex for putting the tool together and making it free to use – especially for any eyebrow-raising results.