This paper in Nature is the first study to report size distributions of SARS-CoV-2 in air. Although the virus itself is 0.1 microns in diameter, we expect it to be released into air in droplets that span a wide range of sizes. The droplets will shrink to less than half their original diameter as some or all of the water evaporates during equilibration with ambient humidity, leaving behind salts, proteins, and other non-volatile components of respiratory fluid. The size of these carrier droplets is incredibly important because it determines how long the virus can remain suspended in air and where in the respiratory system they will deposit if inhaled.
The researchers collected samples in and around two hospitals in Wuhan using a cascade impactor, a device that segregates droplets by size: <0.25 microns, 0.25-0.50 microns, 0.5-1.0 microns, 1.0-2.5 microns, and >2.5 microns. Let’s use 2.5 microns to distinguish between viruses in “fine” droplets vs. “coarse” droplets. The researchers identified virus using qPCR, which tells us the number of copies of viral RNA but does not tell us whether the virus is infectious or not. Typically, we might expect 0.1-1% of viral RNA copies to be associated with an infectious virus; the rest are damaged in some way. More than half the of viral RNA copies were found in fine droplets. These can remain suspended in air for 2 hours or more before settling to the ground, during which time they may be transported tens of meters on currents of air.
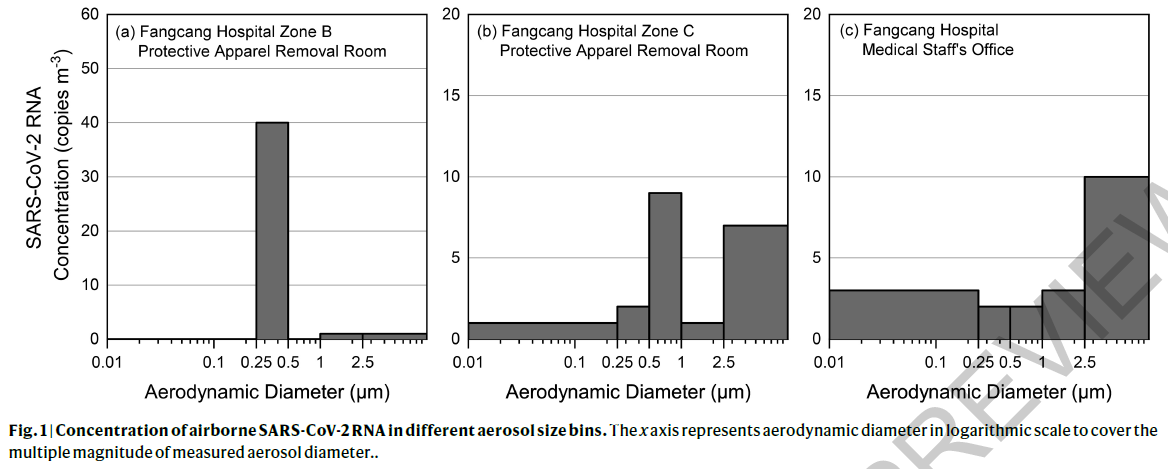
The concentrations were highest (42 copies/m3) in a room where healthcare workers removed PPE. It is likely that the airborne viruses were resuspended from apparel during removal and from the floor. After improved disinfection procedures were implemented, airborne virus was not detectable. The second highest airborne concentration (19 copies/m3) was found in a patient bathroom, a small space of 1 m2 area without ventilation. It is not known whether the virus originated from the patient’s exhalations or was aerosolized from the toilet.
Samples were also collected in public areas of the hospitals, including outdoors, and outside a department store. Virus was undetectable in most samples, but concentrations of 3-11 copies/m3 were found in crowded areas outside the buildings. Someone would need to spend 15 minutes, on average, in this area to inhale one copy of viral RNA. Because only a small fraction of viral RNA copies represent infectious viruses and the infectious dose is probably more than a single virus, the chances of transmission are low, but it would be wise to continue to avoid crowded areas.
Another important finding is deposition rates of 31 and 113 copies/m2/hr on filters placed on the floor in the corner of the intensive care unit, 2-3 meters from patients. These viruses could have traveled through the air and deposited or could have been resuspended from the floor or other surfaces before settling on these filters.
The major limitations of this study are the small number of samples—only three size distributions—and the lack of measurement of virus infectivity. Nonetheless, the size distribution data will contribute to our understanding of how important airborne transmission might be and to efforts to predict the fate of viruses that are released into air.